ENCs, ECDISes, errors and everything else about ENC selection you always wanted to know but were afraid to ask
24 March 2026
What’s it about?
ENCs are a vital part of your navigation system, and most of us don’t think twice about them: they’re just there, and if they’re not, you order them and you have your licenses within minutes. You rely on them for your safe navigation, and as such they are one of your indispensable, invaluable day-to-day tools. You update them regularly, but otherwise, they’re no worry to you.
If you’re a PAYS (Pay As You Sail) user, your only concern is the sheer volume of charts, but that is a completely different topic. If you are, this article is not for you. You might find it interesting, but in the end, you won’t be using any of the knowledge provided here, as the issues addressed here don’t apply to you. The pros and cons of PAYS will be covered at another time. This is meant for those of us who order charts for every specific voyage, and sometimes wonder about the details and if there’s any way to make this easier, other than going full PAYS.
It sounds very simple. Most, if not all, systems, both ECDISes and BoB (Back of Bridge) software, offer you an “Order from route” or “Select from route” functionality. That’s great, right? It works, it’s simple and easy, gives you what you need, and there’s no need to think any further about it.
However, the details matter. The average vessel spends around 6.500,- EUR yearly on ENCs. That may not sound like a lot, compared to your other costs, but if you’re managing a fleet of 50 or 100 vessels, a policy to apply smart chart selection can save you over 100k EUR, without compromising safety or operational efficiency.
To start, some R & R (Rules and Regulations)
Firstly, let’s look at what the legal and regulatory requirements are. Limiting your purchases is a good idea, but you need to make sure you still comply with all relevant regulations.
SOLAS V, more specifically V/19, V/27 and V/34, state what charts you should have, so this should be very clear and obvious.
Except... it’s not. Not really.
SOLAS requirements state vessels must carry “... adequate and up-to-date charts for the intended voyage...”. Up-to-date is clear and undebatable: you must have the latest updates that are available for all the charts you’re using for the planned voyage.
But for “adequate”, there is no clear-cut definition. Like beauty, it is to a large extent in the eye of the beholder. It is implied that you have charts with appropriate scale, providing sufficient detail for safe navigation in the area you are in. It is up to you to decide what is adequate and sufficient detail to ensure the safety of the vessel and everyone on board. No numerical requirements about chart scale are given in any of the regulations.
MSC.1/Circ.1503/Rev.2 - ECDIS – GUIDANCE FOR GOOD PRACTICE only repeats what SOLAS V already states: “…ships must carry all nautical charts necessary for the intended voyage…” and “…all nautical charts necessary for the intended voyage shall be adequate and up to date…”
“necessary for” and “adequate”. No exact specification of what scale bands to use where.
IHO S-66 and IHO S-65 repeat this: ENCs carried must be adequate for the intended voyage. Meaning that the database covers all waters the ship will navigate and is of appropriate scale/detail. So again, open to interpretation.
ECDIS scale bands are defined in these publications as usage or purpose bands, meaning, appropriate for specific parts of the voyage. The typical example here is “Harbour”, which is intended for harbour navigation, but in many cases the harbour charts intersect your route even when you’re not going to that specific harbour.
All this can be interpreted as “always needing the largest scale available for any area of the voyage”, but that is by no means a given, as you will see from the examples in the following paragraphs.
This mainly relates to confined waters, where the largest available scale is expected, more specifically when navigating port approach. This implies that you do not need it when you are not navigating port approach. A passage that is close enough to intersect a harbour chart, with no intention to sail to that port, mostly does not require that specific harbour chart.
The numbers
Here are some details from a study comparing standard ENC selection to a smart selection (we will not use the term “AI assisted” here, it’s just smarter than the straightforward selection-by-intersection that any ECDIS uses).
- The study shows possible savings by comparing the number of ENCs selected by a smart selection algorithm to the number of ENCs selected by standard ECDIS method (bounding box intersects route + fixed buffer).
- Number of routes in the study: 31.
- Short, intermediate and long routes, globally spread.
- ECDIS buffers used: 5 NM and 10 NM (standard settings for different ECDIS brands/types).
- To compensate for any underselection of the smart selection algorithm, a correction of +10% was applied to the number of selected charts.
- Total number of charts selected per route (by standard ECDIS selection) ranges from 17 to 686, with an average per route of 188 for the 10 NM and 156 for the 5 NM buffer.
- Full details about routes and numbers available upon request.
| Buffer | 10 NM | 5 NM | ||
| Smart Selection Correction | +10% | +10% | ||
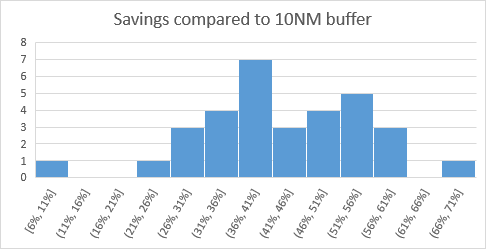
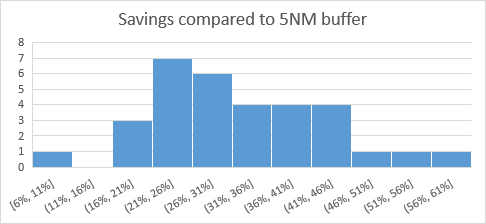
| Average savings | 48% | 43% | 38% | 32% |
| Average weighted savings | 50% | 45% | 40% | 34% |
So even with the 10% margin on the smart selection and the limited buffer of 5 NM, there is a minimum average saving of over 30%. The higher numbers for the weighted savings indicate the savings are bigger for longer routes, having more charts.
The distribution of savings shows higher savings are absolutely realistic:
Behind the scenes
So what exactly is going on? Why and how does an ECDIS or a BoB (Back of Bridge) software overreport charts?
Turns out there are multiple reasons why this can happen:
- Actual coverage versus bounding box
- Multiple coverage caused by different scale bands
- Multiple coverage caused by different flags/hydrographic offices
- Useless coverage by “small corners”
- Useless coverage by excessive buffer values
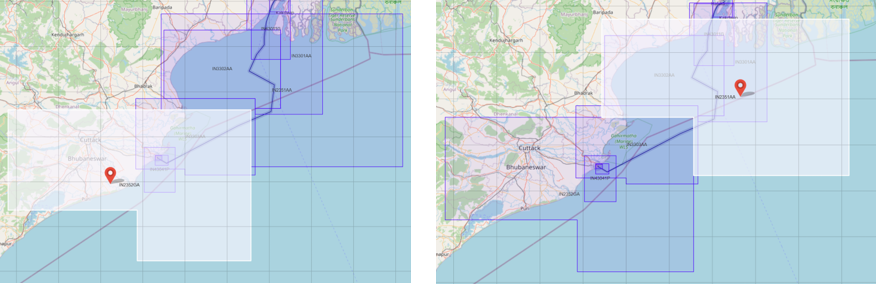
- Actual coverage versus bounding box
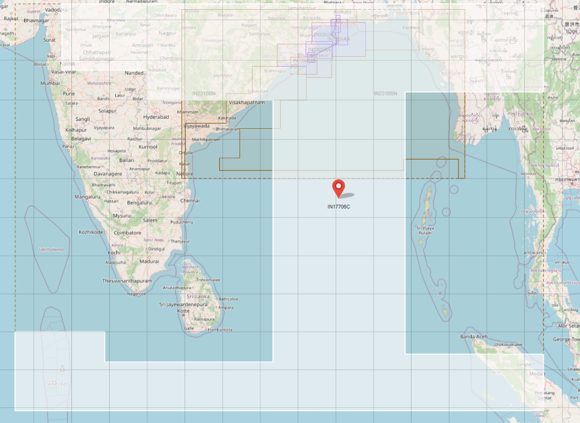
At the moment of writing this, there are 24904 AVCS charts available. 7379 of those, or about 30%, have a bounding box that is different (larger) than the actual chart coverage, meaning, the actual coverage is not a simple rectangle. For those unfamiliar with the term “bounding box”, this is the rectangular envelope around the actual shape of the chart, as shown in these examples:
The white area is the actual coverage, the brown dotted line shows the bounding box.
As can be clearly seen here, the bounding box intersects the buffered route (in dark blue) in the bottom and top right corner, but the actual coverage does not.
Although some ECDISes offer the functionality to check the real coverage versus a plotted route, this only works if the ECDIS already has those charts installed. If the chart is not present in the ECDIS, it only has information about the bounding box and will use that to define charts intersecting the route, resulting in overreporting charts like the ones shown in the above images.
- Multiple coverage caused by different scale bands
This is probably the most debatable coverage issue. It makes total sense to have coverage in multiple scale bands, since you will want clear chart views at all zoom levels on your ECDIS. So some multiple coverage will always exist because of the different scale bands. But that doesn’t mean you have to have all available scale band coverage everywhere along your route.
Do you need band 1 coverage if your route is fully coverd by band 2 charts? No. You may want them for practical and convenience reasons, but they are not strictly necessary for safe navigation.
Below example shows a route that is covered by two band 2 charts:
Do you then need this band 1 chart?
Most probably not. You may choose to have it, but it’s not needed for this route. Yet, in a “blind” selection by your ECDIS, it will be added to the charts you need.
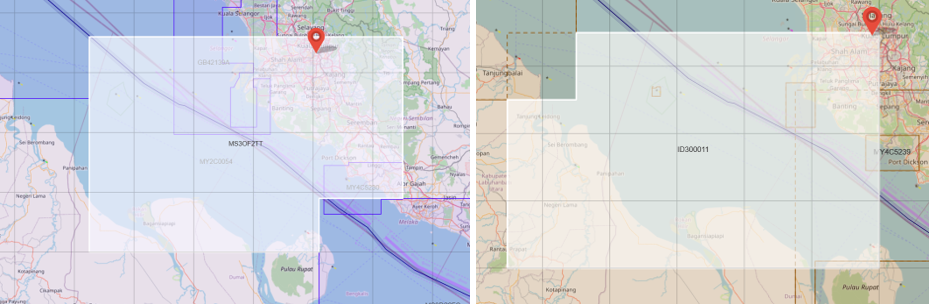
- Multiple coverage caused by different flags/hydrographic offices
In certain areas, different countries cover the same areas with their charts. This results in double coverage for the same scale band. Examples of this are Korea/Japan, Malaysia/Indonesia, Greece/Turkey, and there are others. Although the same scale band does not necessarily mean the same scale, it is clear you do not need both of the charts if they cover the same area. Depending on the ports you visit, you may prefer one or the other. As long as you have adequate coverage, there is no need to have it doubled. Any ECDIS will use a straightforward route-intersecting method that will not take this into account and will get you charts that are not needed.
Below images show coverage of a Malaysian chart and an Indonesian chart for the same area near Kuala Lumpur. The route passing through the Strait of Malakka will not require both these charts, since full band 3 coverage can be achieved by using either Malaysian or Indonesian charts.
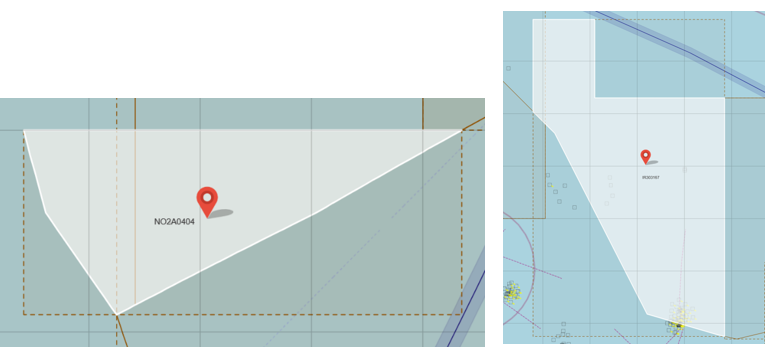
- Useless coverage by “small corners”
Since most routes and coastlines do not go straight north-south or east-west, and most charts have horizontal and vertical edges, the “fit” of chart coverage on routes is far from perfect. In many cases, this results in routes being intersected by charts in just a very small part of the chart coverage.
Some examples (routes + buffer in blue, charts in brown):
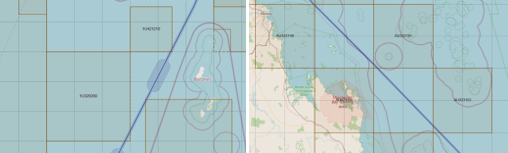
As is clear from these images, although the charts intersect the route, the intersecting area is at the edge of the chart, and that coverage has no added value for navigation.
Again, any ECDIS (or other system) using a straight forward intersection algorithm will add these to your required charts, and you will not use them.
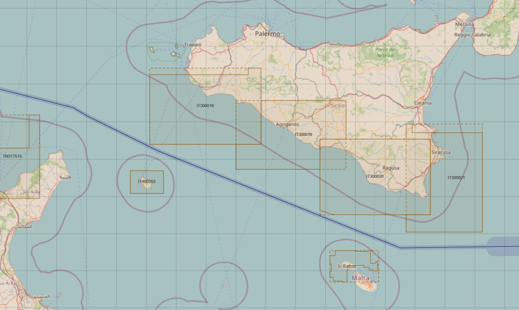
- Useless coverage by excessive buffer values
This is the simplest case: many systems use a standard fixed buffer of 10 or even 20 NM, regardless of the area. Especially in confined and busy waters, vessels often do not even have the option to deviate this far from the planned route. So using a dynamic buffer that is much larger in open waters and ocean crossings, and smaller in confined waters, makes much more sense and will eliminate charts that are too far from the actual route. Setting some buffer is necessary, but the buffer should not be exaggerated.
Below is an example of a voyage passing south of Sicily, showing charts that are within a 10 NM buffer of the route, so that will be selected as “required for this voyage” if you simply use that buffer as the way to select what you need:
Conclusion and caveats
While the ultimate decision of which charts to buy remains yours, hopefully this article has provided some insights on extra considerations you may want to take into account when ordering the charts for your next voyages.
These guidelines on how to avoid overordering should not be taken as absolute, but rather serve as general background information: there can always be reasons why you may want to have extra coverage: expected bad weather causing you to seek shelter in a harbour, rerouting because of storm, uncertainty of the exact route in the planning stage, ...
Given the potential financial benefits, the information presented here will help you make informed decisions for your next purchases and for talking to your chartagent or other suppliers who assist you in selecting your needed charts.